Understanding PCA (Principal Component Analysis)
Introduction
Principal Component Analysis (PCA) is a technique used to reduce the number of variables in a dataset while keeping the most important information. It transforms the original data into a new set of variables called principal components. These components capture the main patterns in the data, making it easier to analyze and visualize. PCA is helpful in preprocessing data, extracting key features, and reducing noise, which can improve the performance and efficiency of machine learning models.
Simple Example
Imagine you have a dataset with measurements of students' height, weight, and arm length. Each measurement is a feature, so you have three features in total. You want to reduce the number of features to make the data easier to analyze, but you still want to keep most of the important information.
Original Data:
Feature 1: Height
Feature 2: Weight
Feature 3: Arm Length
Applying PCA:
- PCA transforms these three features into a new set of features called principal components. The first principal component (PC1) might capture the overall size of the student (a combination of height, weight, and arm length), and the second principal component (PC2) might capture some other pattern, like the proportion between height and arm length.
Resulting Data:
Principal Component 1 (PC1): Represents the overall size of the student.
Principal Component 2 (PC2): Represents another important pattern in the data.
By using just PC1 and PC2, you can work with two features instead of three, but still retain most of the important information from the original dataset.
What's the Need for Reducing Features ?
Reducing features in a dataset is important for several reasons:
Improved Model Performance:
- Simplifies models and reduces the risk of overfitting by eliminating irrelevant or redundant features.
Reduced Computational Cost:
- Decreases the time and resources needed for training and evaluating machine learning models.
Enhanced Data Visualization:
- Makes it easier to visualize and interpret data, especially in 2D or 3D plots.
Noise Reduction:
- Removes noise and irrelevant information, leading to cleaner and more reliable datasets.
Better Generalization:
- Helps models generalize better to new, unseen data by focusing on the most relevant features.
Principal Component Analysis (PCA) in Machine Learning?
PCA can be abbreviated as Principal Component Analysis
PCA comes under the Unsupervised Machine Learning category
Reducing the number of variables in a data collection while retaining as much information as feasible is the main goal of PCA. PCA can be mainly used for Dimensionality Reduction and also for important feature selection.
Correlated features to Independent features
Technically, PCA provides a complete explanation of the composition of variance and covariance using multiple linear combinations of the core variables. Row scattering may be analyzed using PCA, which also identifies the distribution-related properties.
Why Do We Need PCA in Machine Learning?
When a computer learns from a large, well-organized dataset, it often performs very well. However, dealing with high-dimensional data (data with many features) can be challenging, a problem known as the "curse of dimensionality." This is where Principal Component Analysis (PCA) comes in handy.
Handling the Curse of Dimensionality
The curse of dimensionality happens when your data has too many features and not enough data points. This can lead to overfitting, where the model learns too much from the training data and performs poorly on new data.
Benefits of PCA
Dimensionality Reduction:
- PCA helps reduce the number of features in your dataset while retaining the most important information. For example, you might reduce 50 features down to 40, 20, or even 10.
Improving Model Performance:
- By reducing the number of features, PCA helps prevent overfitting and makes the model more generalizable to new data.
Enhancing Interpretability:
- Fewer features make it easier to understand and interpret the model.
Selecting Important Features:
- PCA helps identify the most important features that have the strongest impact on the predictions.
Combining Features:
- PCA creates new features that are linear combinations of the original features, capturing the main patterns in the data.
In summary, PCA is essential in machine learning for simplifying datasets, improving model performance, and making data easier to work with and understand.
Basic Terminologies of PCA
Before getting into PCA, we need to understand some basic terminologies,
Variance – for calculating the variation of data distributed across dimensionality of graph
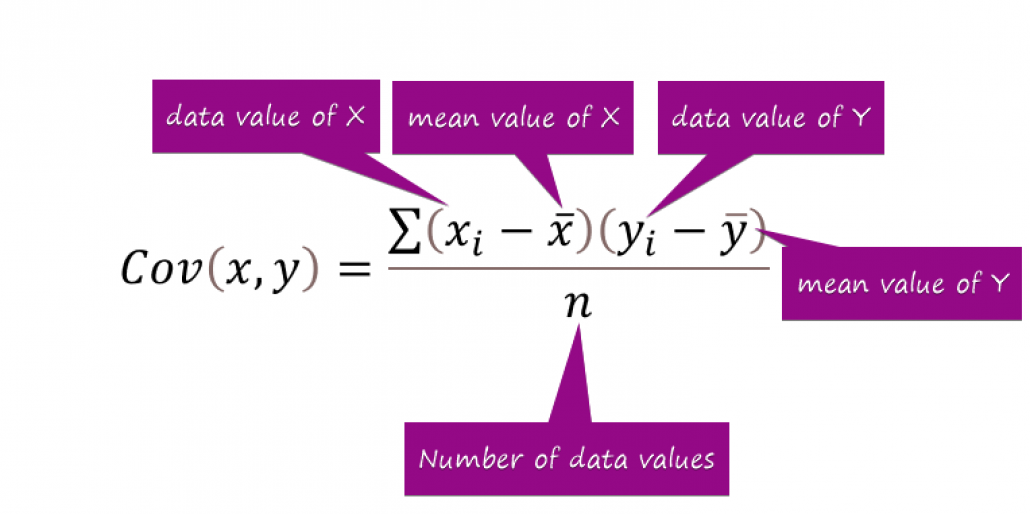
Covariance – calculating dependencies and relationship between features
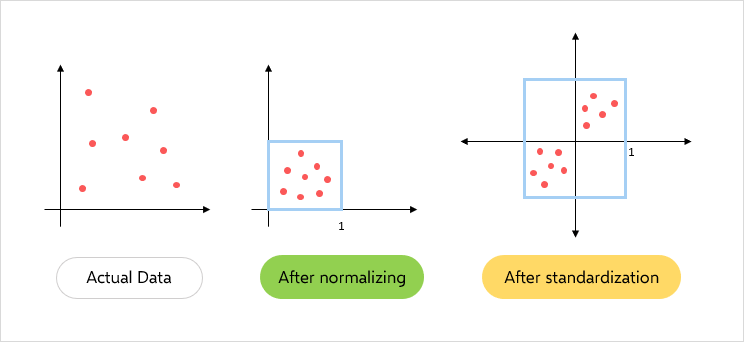
Standardizing data – Scaling our dataset within a specific range for unbiased output
Source: PCA Terminologies
- Covariance matrix – Used for calculating interdependencies between the features or variables and also helps in reduce it to improve the performance
Source: Exceldemy
- EigenValues and EigenVectors – Eigenvectors’ purpose is to find out the largest variance that exists in the dataset to calculate Principal Component. Eigenvalue means the magnitude of the Eigenvector. Eigenvalue indicates variance in a particular direction and whereas eigenvector is expanding or contracting X-Y (2D) graph without altering the direction.
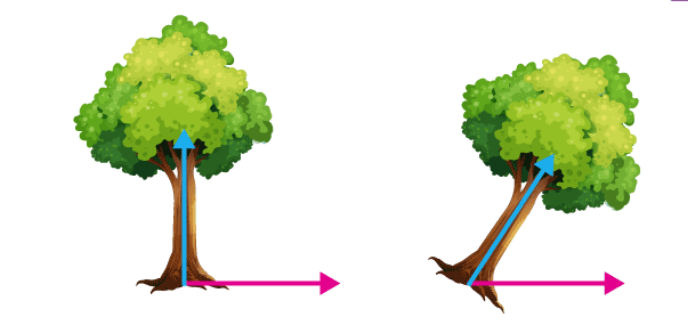
In this shear mapping, the blue arrow changes direction whereas the pink arrow does not. The pink arrow in this instance is an eigenvector because of its constant orientation. The length of this arrow is also unaltered, and its eigenvalue is 1. Technically, PC is a straight line that captures the maximum variance (information) of the data. PC shows direction and magnitude. PC are perpendicular to each other.
- Dimensionality Reduction – Transpose of original data and multiply it by transposing of the derived feature vector. Reducing the features without losing information.

How does PCA work?
The steps involved for PCA are as follows-
Original Data
Normalize the original data (mean =0, variance =1)
Calculating covariance matrix
Calculating Eigen values, Eigen vectors, and normalized Eigenvectors
Calculating Principal Component (PC)
Plot the graph for orthogonality between PCs
Why Do We Need to Standardize the Data?
Key Reasons:
Equal Weightage:
- Standardizing ensures all features contribute equally to the analysis, preventing features with larger scales from dominating the results.
Improved Accuracy:
- Standardization can lead to more accurate principal components by giving each feature the same importance.
Compatibility with PCA:
- PCA is sensitive to the scale of the data, and standardizing ensures the algorithm works effectively by focusing on the relationships between features rather than their magnitudes.
Standardizing the data ensures fair and balanced contribution from all features, leading to better and more meaningful results in PCA.
What is the Need for the Covariance Matrix in PCA?
Key Points:
Understanding Feature Relationships:
The covariance matrix measures how much two features vary together.
Positive covariance indicates that as one feature increases, the other tends to increase as well.
Negative covariance indicates that as one feature increases, the other tends to decrease.
Basis for Principal Components:
The covariance matrix helps in identifying the directions (principal components) where the data varies the most.
Principal components are derived from the eigenvectors of the covariance matrix, which point in the direction of maximum variance.
Dimensionality Reduction:
By examining the eigenvalues of the covariance matrix, we can determine the most significant principal components.
This allows us to reduce the number of dimensions while retaining the most important information.
Data Transformation:
The covariance matrix is used to transform the original data into a new set of uncorrelated features (principal components).
This transformation simplifies the data structure and makes it easier to analyze and interpret.
Summary:
The covariance matrix is crucial in PCA because it provides a detailed understanding of the relationships between features, identifies directions of maximum variance, and serves as the foundation for transforming and reducing the dimensions of the dataset.
Why Do We Need to Calculate Eigenvalues, Eigenvectors, and Normalized Eigenvectors in PCA?
Identifying Principal Components:
Eigenvectors: These determine the directions of the new feature space. Each eigenvector points in a direction where the data varies the most.
Eigenvalues: These indicate the magnitude of variance in the direction of their corresponding eigenvectors. Larger eigenvalues correspond to principal components that capture more variance.
Dimensionality Reduction:
- By selecting the top eigenvectors (based on their eigenvalues), we can reduce the number of dimensions while preserving the most significant patterns in the data. This helps in simplifying the dataset without losing crucial information.
Transforming the Data:
- Normalized Eigenvectors: These ensure that the principal components have unit length, making them easier to work with and interpret. Normalizing eigenvectors standardizes the length of the principal components, providing consistency.
Constructing the New Feature Space:
- The eigenvectors form the axes of the new feature space, and the data is projected onto these axes. This new feature space, defined by the principal components, captures the most important aspects of the original data.
Improving Computational Efficiency:
- By focusing on a smaller number of principal components, computational efficiency is improved, especially for large datasets. This makes further data processing and analysis faster and more manageable.
Summary:
Calculating eigenvalues, eigenvectors, and normalized eigenvectors is essential in PCA for identifying the principal components, reducing dimensionality, transforming the data, constructing a new feature space, and improving computational efficiency. These calculations enable us to simplify complex datasets while retaining their most important characteristics.
Reducing Dimensions with PCA: A Simple Example
Step-by-Step Process
Standardize the Data:
Ensure that each feature has a mean of 0 and a standard deviation of 1.
This is important because PCA is sensitive to the relative scales of the data.
Calculate the Covariance Matrix:
- Compute the covariance matrix to understand the relationships between the features.
Compute Eigenvalues and Eigenvectors:
Calculate the eigenvalues and eigenvectors of the covariance matrix.
Eigenvectors indicate the directions of the maximum variance, and eigenvalues show the magnitude of variance in these directions.
Select Principal Components:
Choose the top k eigenvectors (principal components) that correspond to the largest eigenvalues.
These principal components capture the most significant variance in the data.
Transform the Data:
Project the original data onto the selected principal components.
This results in a new dataset with reduced dimensions.
Simple Example
Imagine you have a dataset with two features: Height and Weight.
Original Data:
Feature 1: Height
Feature 2: Weight
Standardize the Data:
- Standardize Height and Weight to have a mean of 0 and a standard deviation of 1.
Covariance Matrix:
- Calculate the covariance matrix to see how Height and Weight are related.
Eigenvalues and Eigenvectors:
Compute the eigenvalues and eigenvectors of the covariance matrix.
Suppose you get two eigenvectors: PC1 and PC2, with PC1 capturing more variance than PC2.
Select Principal Components:
- Choose PC1 because it captures the most variance.
Transform the Data:
Project the original Height and Weight data onto PC1.
The new dataset now has only one feature (PC1) instead of two, reducing the dimensions from 2 to 1.
Summary
By following these steps, PCA reduces the number of features in your dataset while retaining the most important information. This simplifies the dataset, making it easier to analyze and interpret, and helps improve the performance of machine learning models.
Conclusion
Principal Component Analysis (PCA) is a powerful technique in machine learning for simplifying complex datasets and reducing dimensionality while preserving essential information. By identifying the principal components through the calculation of eigenvalues and eigenvectors, PCA allows us to understand the underlying structure of the data and extract its most significant patterns. Normalizing eigenvectors ensures consistency and ease of interpretation in the new feature space. Overall, PCA enables more efficient data analysis, improved model performance, and better insights into the data, making it a valuable tool in various fields, from finance and healthcare to image processing and natural language processing. Mastering PCA empowers data scientists and analysts to unlock hidden patterns, optimize algorithms, and make informed decisions based on data-driven insights.